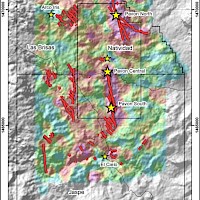
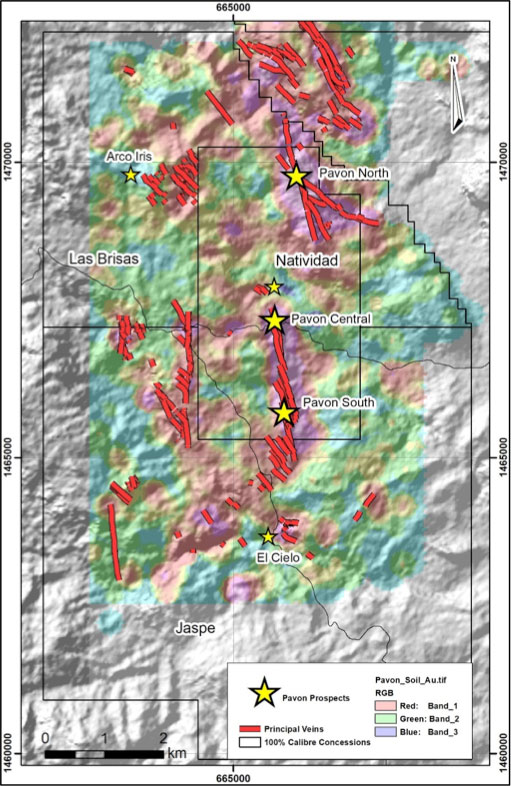
The Pavon property is located within the Natividad and Las Brisas exploration concessions totaling 31.5km2 located approximately 300 kms on paved highways from the Libertad processing facility.
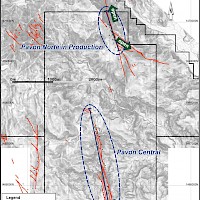
Since acquiring the asset in 2019 Calibre completed an initial open pit resource estimate, initiated and completed the Environmental Impact Assessment (“EIA”) for Pavon Norte, completed mine design and construction and began open pit mining and transporting to the Libertad processing plant.
By implementing our ‘Hub-and-Spoke’ operating model and by developing the Pavon gold project, the Libertad Complex processing life has been significantly extended and is now expected to generate robust cash flows over several years.
The Pavon satellite deposit (“Spoke”) feeding into the Libertad Complex represents a portion of the mill feed from 2021 through 2024. The Pavon PFS demonstrates the value of the Company’s operating approach by utilizing the surplus capacity at the Libertad mill, investing in exploration to expand the current mineral resource base at Pavon as well as the opportunity for additional low-cost growth. Over 50% excess mill capacity exists at the Libertad mill underpinning Calibre’s focus on exploration to expand resources and discover new satellite deposits which could provide future mill feed.
Pavon represents an average of 0.32 million tonnes per annum of mill feed over the next four years, additional mill feed sources include those at Limon and Libertad as per the 2020 Preliminary Economics Assessment (“PEA”) (see August 11, 2020 news release for further details) leaving an average of 1.5 million tonnes of surplus annual mill capacity over the next four years as a significant opportunity for organic growth via further conversion of Mineral Resources, exploration success, artisanal ore purchases or toll milling.
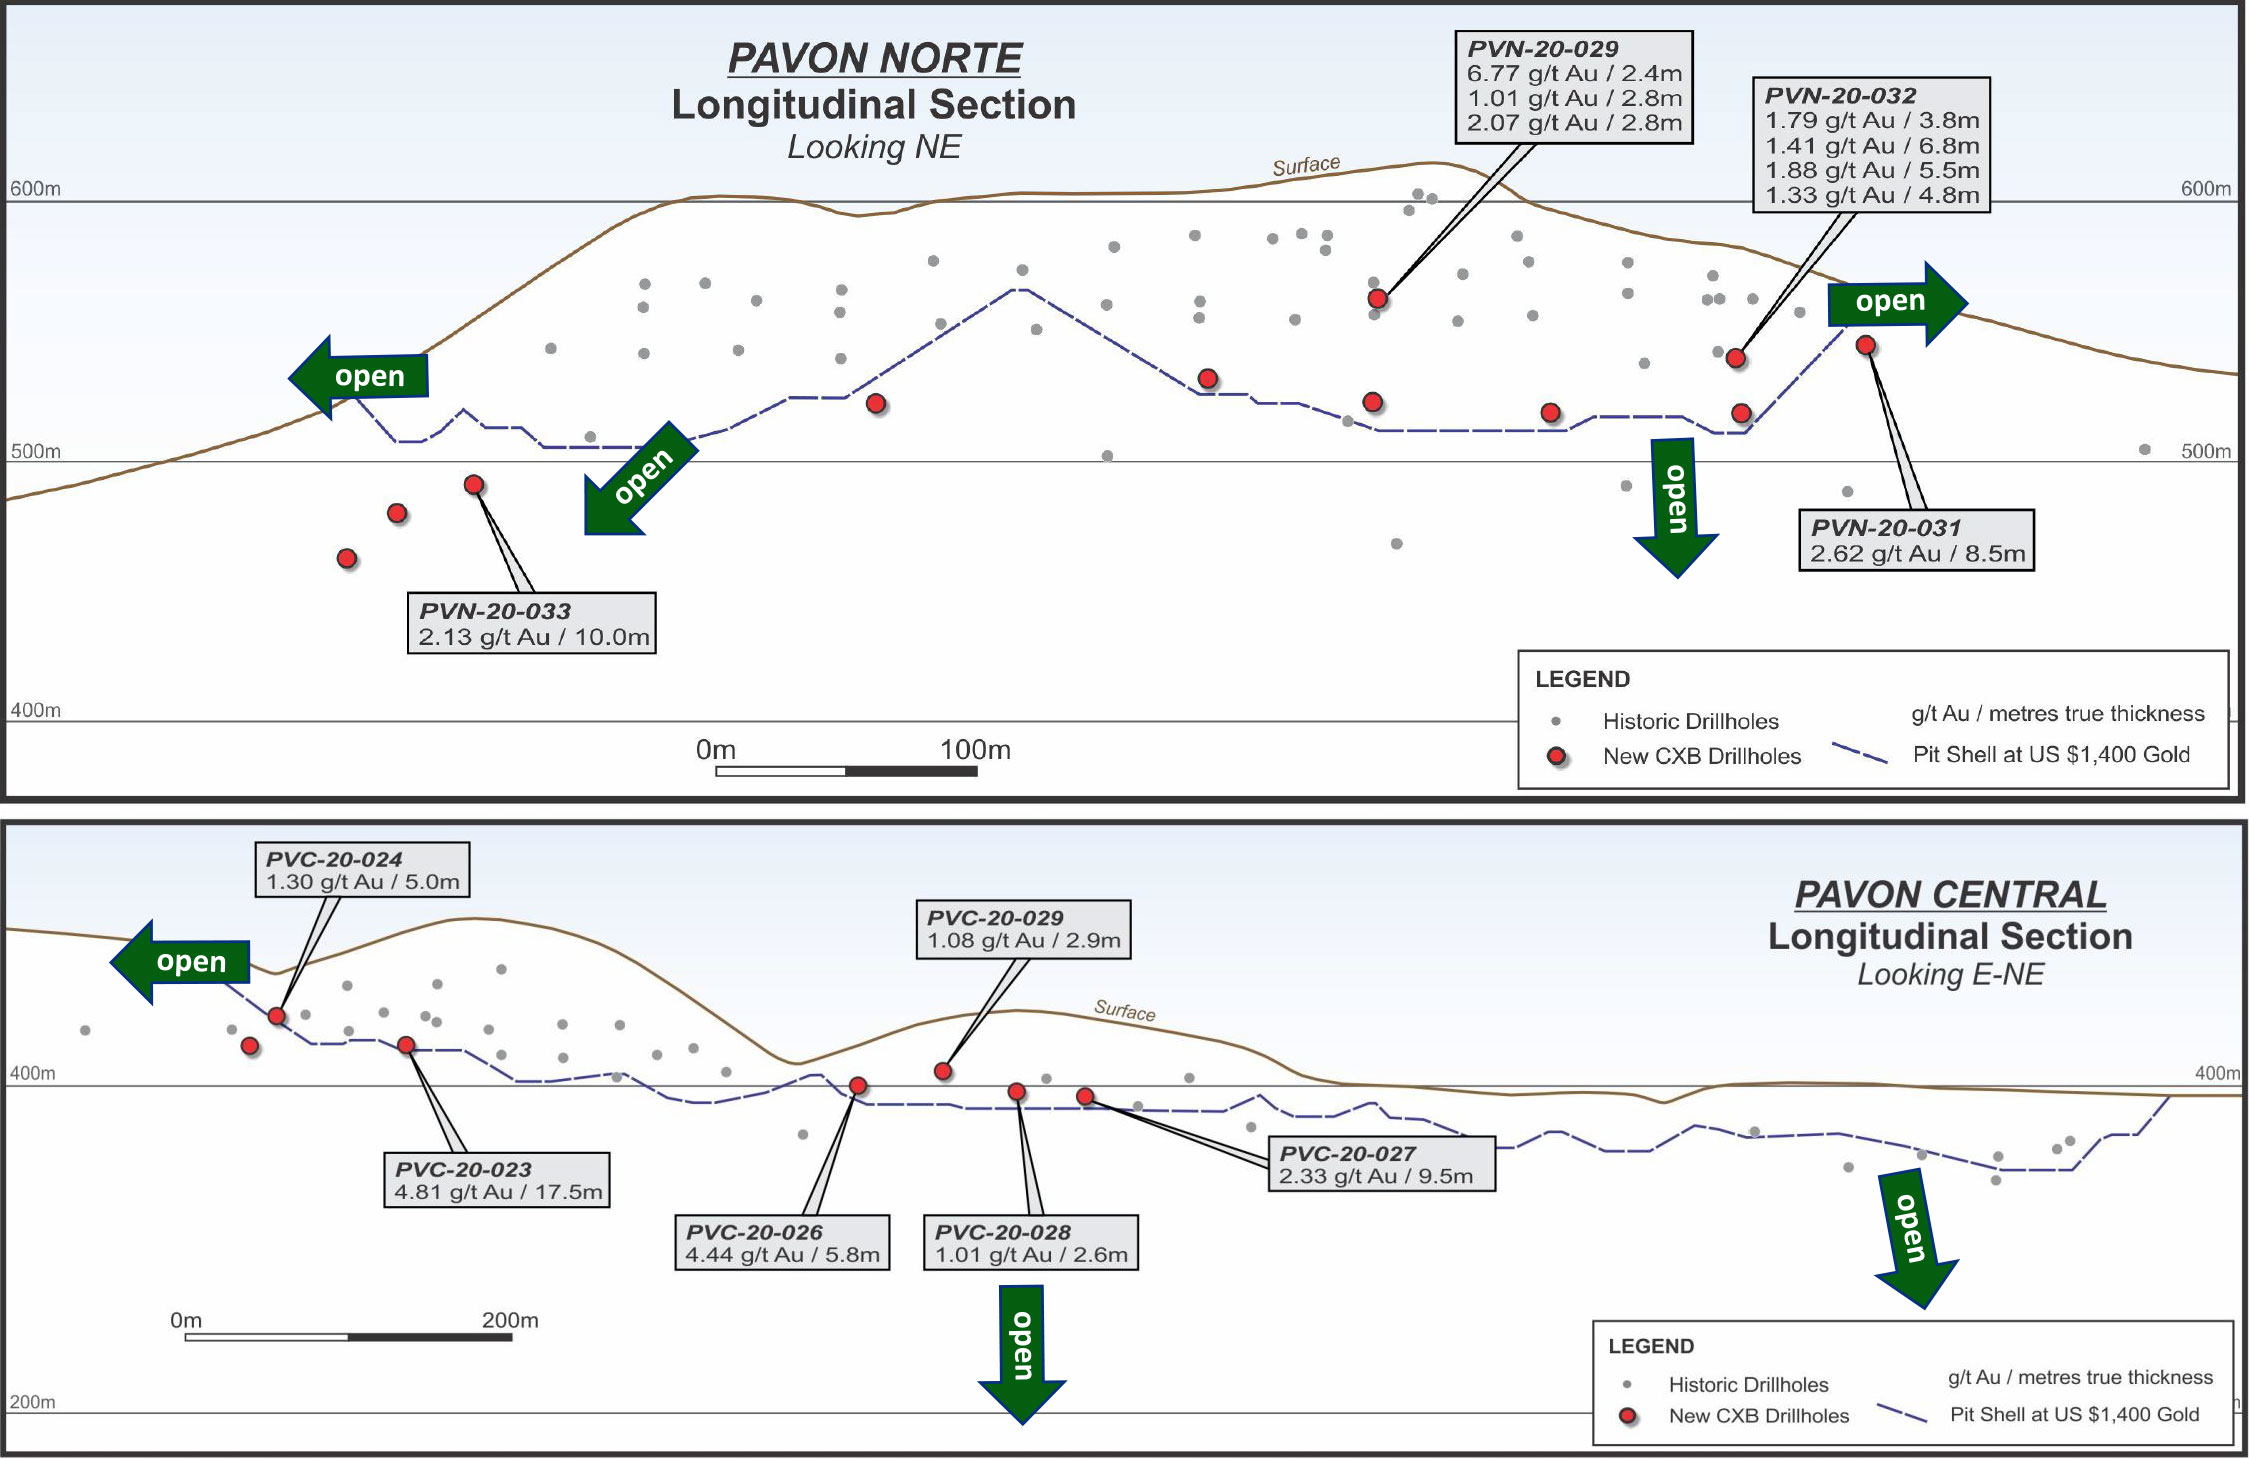
The Pavon project represents a newly emerging gold district in Nicaragua in a region that has remained largely underexplored by modern methods. Historical exploration focused on delineating resources within the near surface portions of the Pavon Norte, Central and South deposits where indicated resources totaling 231,000 ounces of gold averaging 5.16 g/t have been delineated within the upper 100 meters.
Pavon Opportunities & Exploration Potential
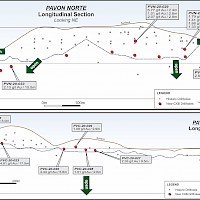
- Commercial production commenced in 2021 (2021 Pavon PFS, based on drilling up to 2015)
- Mineral Reserves of 120 koz at 6.56 g/t Au1, Indicated Mineral Resources of 131 koz at 5.88 g/t Au1 (inclusive of Reserves), Inferred Mineral Resources of 96 koz at 4.02 g/t Au1
- Limited historical exploration, which focused on Pavon North
- Multiple untested vein systems identified with more suspected under cover
- Initial 8 km resource confidence & extension drill program underway on high-grade vein systems covering >30 km2
- Final approval process underway with additional surrounding mineral concessions (~45km2)
1 See disclosure and Mineral Resources and Mineral rReserves for further details. Updated Mineral Resources and Mineral Reserves are as of December 31, 2022 on sedar.com or Calibremining.com
2021 PAVON PRE-FEASIBILITY STUDY RESULTS (now in production – hauling ore to the La Libertad processing facility)
PAVON OPEN PIT GOLD MINE: PFS HIGHLIGHTS
|
$1,400 per ounce |
|
4 years |
|
877 tonnes per day |
|
4.86 g/t gold, 7.0 g/t silver |
|
94% gold, 35% silver |
|
47,000 ounces |
|
$650 per ounce |
|
$711 per ounce (net of Ag credits) |
|
188,213 ounces |
|
$106.4 million |
OPPORTUNITIES
- Reserves consider no new drill data after December 2015;
- Step out drilling underway to expand gold resources along strike and down dip;
- Additional resources outside of the reserve mine plan offer potential to extend mine life;
- Significant surplus capacity at the Libertad mill;
- Underpins potential for low-cost organic production growth.
TABLE 1 - PAVON RESERVE ESTIMATE (DECEMBER 31, 2020)2
| CLASSIFICATION | DEPOSIT | TONNES (‘000 T) |
GRADE (AU G/T) |
GRADE (AG G/T) |
AU OUNCES (‘000 OZ) |
AG OUNCES (‘000 OZ) |
|
|---|---|---|---|---|---|---|---|
| Probable | Pavon Norte | 759 | 3.42 | 4.33 | 83 | 106 | |
| Probable | Pavon Central | 522 | 6.96 | 10.95 | 117 | 184 | |
| Probable | Total Pavon | 1,281 | 4.86 | 7.02 | 200 | 290 | |
TABLE 2 – PAVON RESOURCE ESTIMATE* (DECEMBER 31, 2020)3
| CLASSIFICATION | DEPOSIT | TONNES (000 T) |
GRADE (AU G/T) |
GRADE (AG G/T) |
AU OUNCES (‘000 OZ) |
AG OUNCES (‘000 OZ) |
|
|---|---|---|---|---|---|---|---|
| Indicated | Pavon Norte | 863 | 3.58 | 4.77 | 99 | 132 | |
| Indicated | Pavon Central | 529 | 7.73 | 12.55 | 131 | 213 | |
| Indicated | Total | 1,392 | 5.16 | 7.72 | 231 | 346 | |
| *Indicated Mineral Resources are inclusive of Mineral Reserves. | |||||||
| CLASSIFICATION | DEPOSIT | TONNES (000 T) |
GRADE (AU G/T) |
GRADE (AG G/T) |
AU OUNCES (‘000 OZ) |
AG OUNCES (‘000 OZ) |
|
| Inferred | Pavon Norte | 98 | 3.53 | 6.16 | 11 | 19 | |
| Inferred | Pavon Central | 153 | 4.46 | 7.68 | 22 | 38 | |
| Inferred | Pavon South | 326 | 2.85 | 3.22 | 30 | 34 | |
| Inferred | Total | 577 | 3.39 | 4.90 | 63 | 91 | |
TABLE 3 – PAVON: PFS FINANCIAL SENSITIVITY MODEL ($ MILLION, AFTER-TAX)
| GOLD PRICE ASSUMPTION ($/OZ) | 1,400 | 1,500 BASE CASE |
1,700 | 1,900 |
|---|---|---|---|---|
| Cumulative after-tax free cash flow ($’000) | 80,220 | 92,824 | 118,032 | 143,240 |
| After-tax NPV5% ($’000) | 71,760 | 83,294 | 106,364 | 129,433 |
| After-tax NPV10% ($,000) | 64,585 | 75,211 | 96,463 | 117,715 |
The financial models in the PFS were prepared by SLR Consulting (Canada) Ltd. (formerly Roscoe Postle Associates Inc.). The PFS includes metal price sensitivities detailed in the technical report, which is expected to be published on www.sedar.com in March 2021.
TABLE 4 – PAVON: PFS PRODUCTION AND COST OUTLOOK
| 2021 | 2022 | 2023 | 2024 | TOTAL | ||
|---|---|---|---|---|---|---|
| Tonnes Mined (000t) | 281 | 299 | 424 | 276 | 1,281 | |
| Waste Mined (000t) | 2,235 | 3,266 | 4,898 | 3,556 | 13,954 | |
| Strip ratio (W:O) | 7.95 | 10.91 | 11.54 | 12.87 | 10.89 | |
| Tonnes Milled (000t) | 281 | 279 | 410 | 311 | 1,281 | |
| Grade Milled (g/t Au) | 3.54 | 3.48 | 5.85 | 5.99 | 4.86 | |
| Gold Production (oz) | 30,075 | 29,339 | 72,615 | 56,183 | 188,213 | |
| Total Cash Costs1 ($/oz) | 849 | 939 | 540 | 536 | 650 | |
| AISC1 ($/oz) | 943 | 939 | 622 | 536 | 711 | |
| Non-Sustaining Capital ($m)* | 9.45 | 2.54 | - | - | 11.99 | |
*Includes 14% contingency.
NOTE 2: Pavon Reserves
1 The mineral reserve estimates were prepared by Shane Ghouralal, P.Eng. MBA (Qualified Person for these mineral reserve estimates), reported using the 2014 CIM Definition Standards, and have an effective date of December 31, 2020.
2 Mineral reserves are mined tonnes and diluted grade; the reference point is the mill feed at the primary crusher.
3 Mineral reserves are reported at a cut-off grade of 1.26 g/t Au.
4 Cut-off grade assumes Au of US$1,400/oz; 100% payable gold with a royalty of US$28/oz; selling cost are US$4.38/oz including offsite costs (refining and transport); and uses an 94% metallurgical recovery for Au and 35% for Ag. The cut off-grade covers processing costs of US$22.62/t, hauling costs of US$31.91/t, administrative (G&A) costs of US$4.91/t, tailings facility costs of US$2.56/t.
NOTE 3: Pavon Resources
1 Mineral Resources were prepared in accordance CIM (2014) definitions. Mineral Resources that are not Mineral Reserves do not have demonstrated economic viability.
2 Mineral Resources are inclusive of Mineral Reserves.
3 This estimate of Mineral Resources may be materially affected by environmental, permitting, legal, title, taxation, sociopolitical, marketing, or other relevant issues.
4 Open Pit Mineral Resources are reported at cut-off grades of 1.17 g/t Au. Mineral Resources are estimated using a long-term gold price of US$1,500 per ounce.
5 Appropriate mining costs, processing costs, metal recoveries, and inter-ramp pit slope angles were used to generate the pit shell.
6 Rounding may result in apparent summation differences between tonnes, grade, and contained metal content. Tonnage and grade measurements are in metric units. Contained gold ounces are in troy ounces.
7 Composites completed at 2 m down the hole.
8 Contributing assay composites were capped at 29.03 g/t Au at Pavon Norte, 75 g/t Au at Pavón Central, and 17.18 g/t Au at Pavon South.
9 A specific gravity value of 2.49 was applied to all blocks in rock and 2.30 was applied to all blocks in saprolite.
